the outlier ranking
Find the videos beating their own channel.
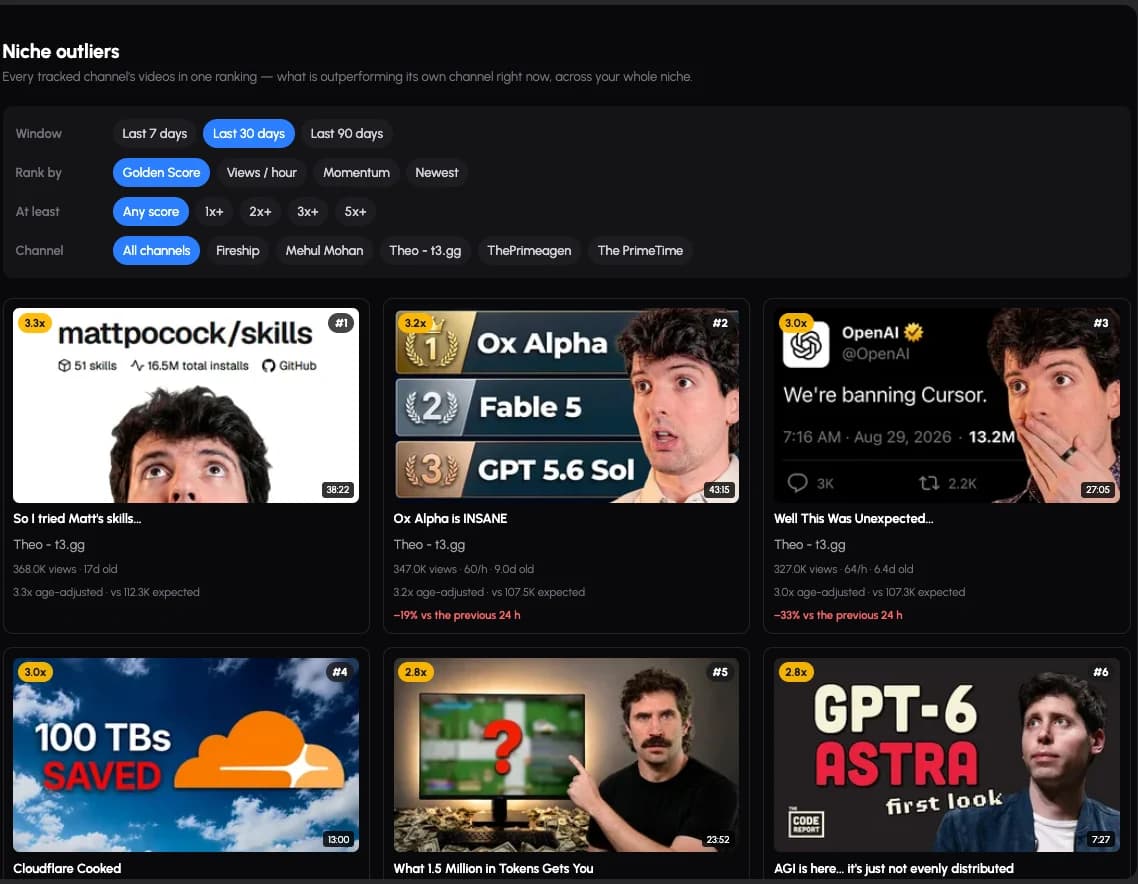
The outlier ranking scores every video across every channel you track against what that same channel’s other videos had achieved at the same age, and sorts your whole niche by the result. A 3.0× means the video is running at three times its own channel’s pace for a video that old — so a small channel’s breakout ranks next to a large channel’s, instead of being buried under it.
YouTube Niche Monitoring Features▶ Watch the 1:22 walkthrough
Why a raw multiplier is not enough.
The usual outlier metric is a video’s views divided by its channel’s median views. It is a good question badly asked, because it punishes anything new: a six-hour-old upload is compared against a back catalogue that has had months to accumulate, so it always loses, and the videos you most want to see are the ones the metric hides.
This ranking adjusts for age instead. A video’s score is its views now, divided by what that channel’s other videos had at the same age. The expectation is read off each of those videos’ own view curves and interpolated to the target age, so a six-hour-old upload is compared against how the channel’s other videos looked six hours in.
That is why the number is comparable across ages. A 3.0× on a fresh upload and a 3.0× on a two-week-old video mean the same thing: three times the channel’s own pace at that point in a video’s life.
What it does when it cannot know.
The comparison needs peers — other videos from the same channel whose recorded curves actually cover the age being scored. Tracking only holds samples from the moment you started, so early on, that coverage does not exist.
When fewer than three peers cover the target age, the score falls back to the plain multiplier and is labelled as such on the card, so you know which question was answered. When there are not enough peers for even that, the video carries no score and a short reason instead of a number. Nothing is filled in with a default.
The ranking can be read over the last 7, 30 or 90 days, ordered by the age-adjusted score, by raw views per hour, by momentum or by recency, and narrowed to a minimum score or a single channel. The card shows the view count, the age, the views per hour, the expected figure the score was computed against, and how the video moved in the last 24 hours — including when that movement is negative, which is the number most tools quietly omit.

A ranking of ideas, not a ranking of channels.
Because every video is scored against its own channel, the list mixes channel sizes freely. What rises is the format, the topic and the packaging that outperformed — which is what you were looking for when you opened it — rather than whoever has the largest audience in your niche.
where this stops
What it does not do.
- It reports the multiple and what it was measured against. It does not tell you why the video worked or what to make next; there is no language model in this product.
- It scores views. Watch time, retention and click-through rate are private to the channel owner and are not estimated here.
- It needs peer history to be age-adjusted. Until that exists it says which weaker question it answered, or declines to answer.
questions
About the outliers.
What exactly does a 3.0× mean?
That the video has about three times the views the rest of its channel had at the same age. The expectation is the median of the channel’s other videos, read off their own view curves at that age, and the card prints the expected figure next to the score.
Why is a score sometimes labelled differently?
Because the age-adjusted comparison needs at least three of the channel’s other videos whose recorded history covers that age. When it has fewer, it falls back to the simple views-over-median multiplier and says so, and when it has fewer still it shows no score and a reason.
Does a big channel dominate the ranking?
No, and that is the point of scoring each video against its own channel. A 500-subscriber channel’s breakout and a million-subscriber channel’s breakout appear at the same multiple.
Can I see outliers for one channel only?
Yes. The ranking filters to a single tracked channel, and to a minimum score, over a 7, 30 or 90 day window.
Does it predict which videos will take off?
No. It reports how a video is performing now against a measured expectation. It makes no forecast and offers no advice.
the rest of it
Three more views on the same record.
01 Feed
Track competitor YouTube channels in one stream.
Every change across the channels you track, in the order it happened.
02 Watchlist
Compare every channel in your niche, side by side.
One table for the whole niche, with a median row that shows its n.
04 Packaging
Every title and thumbnail change, with what it was before.
Title and thumbnail history, both sides of every swap, plus detected A/B tests.