the watchlist
Compare every channel in your niche, side by side.
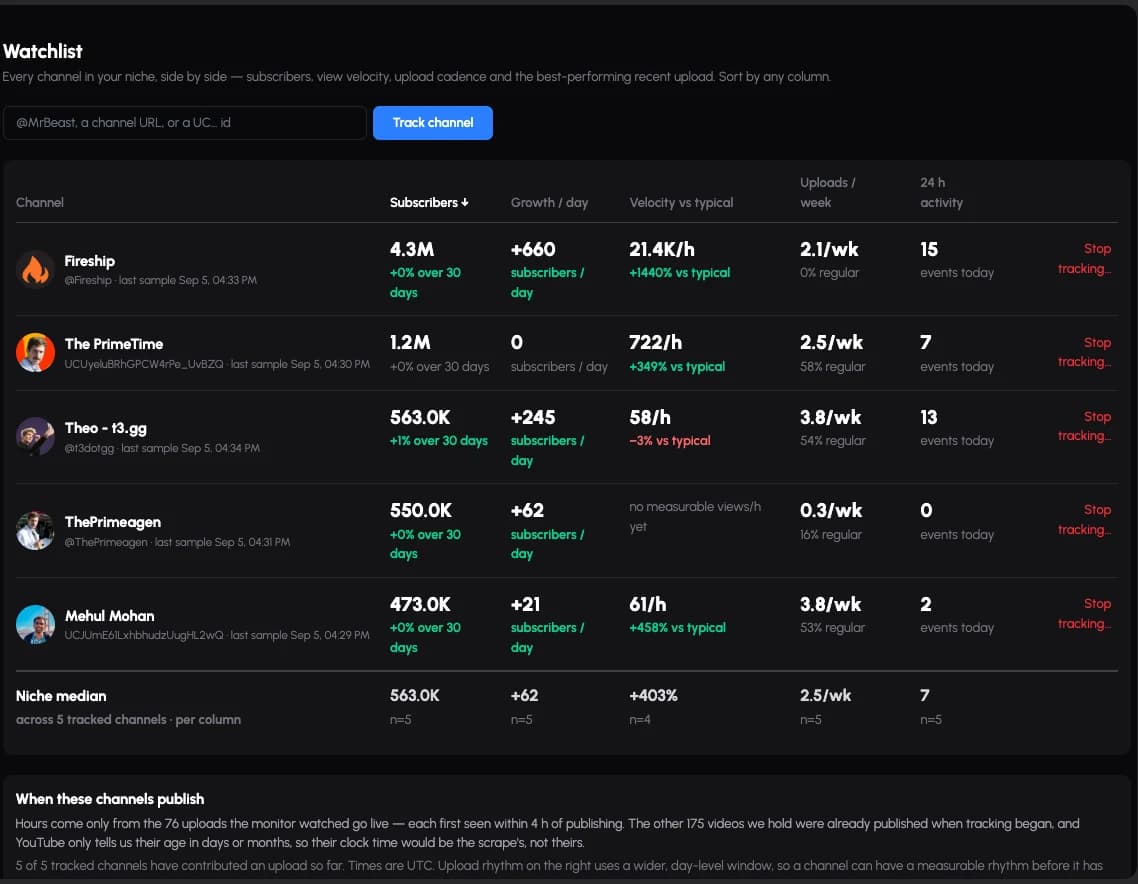
The watchlist puts every channel you track in one sortable table: subscribers, subscriber growth per day, current views per hour against that channel’s own typical rate, uploads per week, and activity in the last 24 hours. A median row underneath shows where the middle of your niche sits, with the number of channels each median was computed from.
Ranking, not just listing.
Every column sorts, so the table answers the questions you actually arrive with. Who is growing fastest right now, rather than who is biggest. Who is running hot against their own baseline, which is a different question from who has the most views. Who has gone quiet. Whose upload cadence you are quietly falling behind.
The “velocity vs typical” column is the one that does the most work. A raw views-per-hour number tells you a channel is large; the same number against that channel’s own normal rate tells you something is happening. A 500-subscriber channel running at four times its usual pace is a signal, and a table that only ranks by size buries it.
The median row underneath is the niche itself, per column, with the count of channels behind each figure printed next to it. A median over four channels and a median over forty are not the same claim, so the table says which one you are reading.
Publish rhythm, and where it stops being honest.
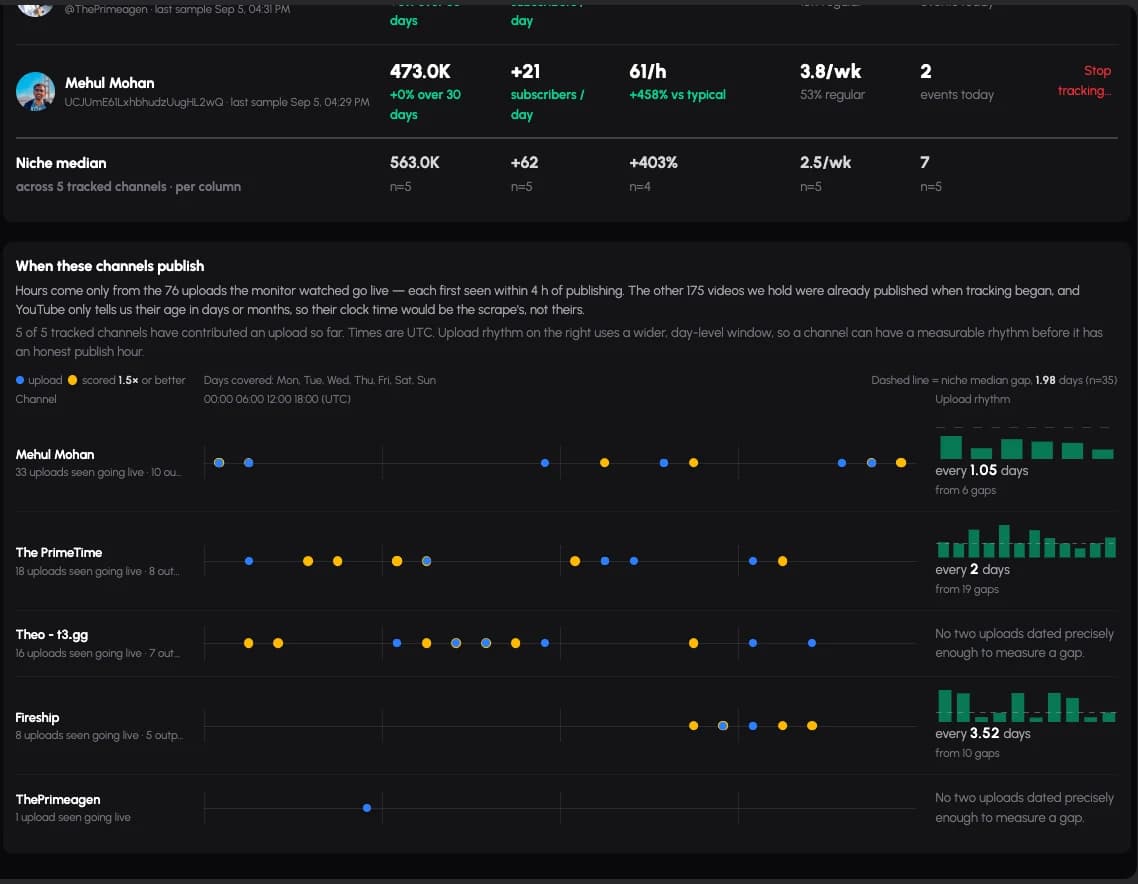
Below the table is the timing panel: for each channel, the hours its uploads went live, and how many days typically pass between them.
This is the part of the product that most tools get wrong, so it is worth being precise about. YouTube does not publish an exact upload timestamp on a channel page — it publishes relative text like “3 days ago”. A tool that converts that into a clock time and draws an hour-of-day chart is drawing the time its own scraper happened to run, dressed up as the creator’s schedule.
So the hour comes from two places only. YouTube’s own feed lists each channel’s newest uploads with an exact publish time, and those are used as they are. Older uploads are reported only if this monitor watched them go live: those were first seen while the relative text was still in minutes or hours, which makes the stored timestamp a real publish instant. Everything else is excluded from the hour view, and the page says how many videos that is. Upload gaps are a day-scale question and survive the day-level rounding, so they use a wider window — which is why a channel can have a measurable rhythm before it has an honest publish hour.
When there is not enough of either, the row says “No two uploads dated precisely enough to measure a gap” instead of printing a number. That sentence is a feature. Every figure this product shows is one you can act on, because the ones it cannot stand behind are absent.
Built from the same record as everything else.
Nothing in this table is a separate data source. Subscribers, views and uploads are the same observations that fill the feed, the outlier ranking and the packaging archive, so a number here and a number there cannot disagree. Adding or removing a channel changes all four views at once.
where this stops
What it does not do.
- It compares the channels you chose. There is no “my channel vs the niche” benchmark, because that would require access to your own analytics, and the product does not ask for it.
- Medians are computed over your watchlist, not over YouTube. They describe your niche as you defined it, and the page prints the sample size so you can judge it.
- A publish hour is shown only when YouTube’s feed gave the exact time or the monitor saw the upload go live. Where neither exists, the panel says so rather than estimating.
questions
About the watchlist.
What does “velocity vs typical” compare against?
Against the channel’s own recent view rate, not against other channels. It answers whether that channel is running above or below its own normal pace, which is what makes a small channel’s surge visible next to a large channel’s ordinary day.
Why do some channels show no publish hour?
Because neither honest source covered its uploads yet. YouTube’s feed gives exact publish times, but only for a channel’s newest uploads, and a channel page only says how old an older video is, in days or months. If a video was already published when tracking began and the feed does not list it, its clock time would be the time our scraper first saw it, not the time the creator published, so the hour is left out entirely rather than invented.
What is the niche median?
The middle value across the channels on your watchlist, computed per column and shown with the number of channels it came from. It is a description of the channels you chose to track, not a claim about YouTube as a whole.
Can I sort by any column?
Yes. Every column in the table sorts, and the median row stays pinned underneath so the middle of the niche is always in view.
Does the watchlist show my own channel?
Only if you add it as a tracked channel, in which case it is treated exactly like any other public channel. There is no private-analytics integration and no benchmark against your own YouTube Studio data.
the rest of it
Three more views on the same record.
01 Feed
Track competitor YouTube channels in one stream.
Every change across the channels you track, in the order it happened.
03 Outliers
Find the videos beating their own channel.
Every tracked video, ranked by how far it is beating its own channel.
04 Packaging
Every title and thumbnail change, with what it was before.
Title and thumbnail history, both sides of every swap, plus detected A/B tests.